
One of the little pleasures to be derived from getting promoted out of the National League is the massive improvement in the amount of data which is now available to analyse Wrexham’s matches.
Sorry for being a nerd, but I enjoy digging around to evidence to help me evaluate a performance.
I’m no expert, but sometimes the statistics can reveal interesting details.


For example, while losing your first game of the season at home is obviously a bad thing, looking at the data from the MK Dons game suggests that, on the whole, we were the better side.
We had more shots on goal than anybody else on the opening day of the League Two season, and restricted the visitors to just 6!
They were certainly ruthless with their finishing, leading many to suggest that this was a harsh introduction to the standards of League Two finishing. The statistics suggest, though, that it was an outlier.
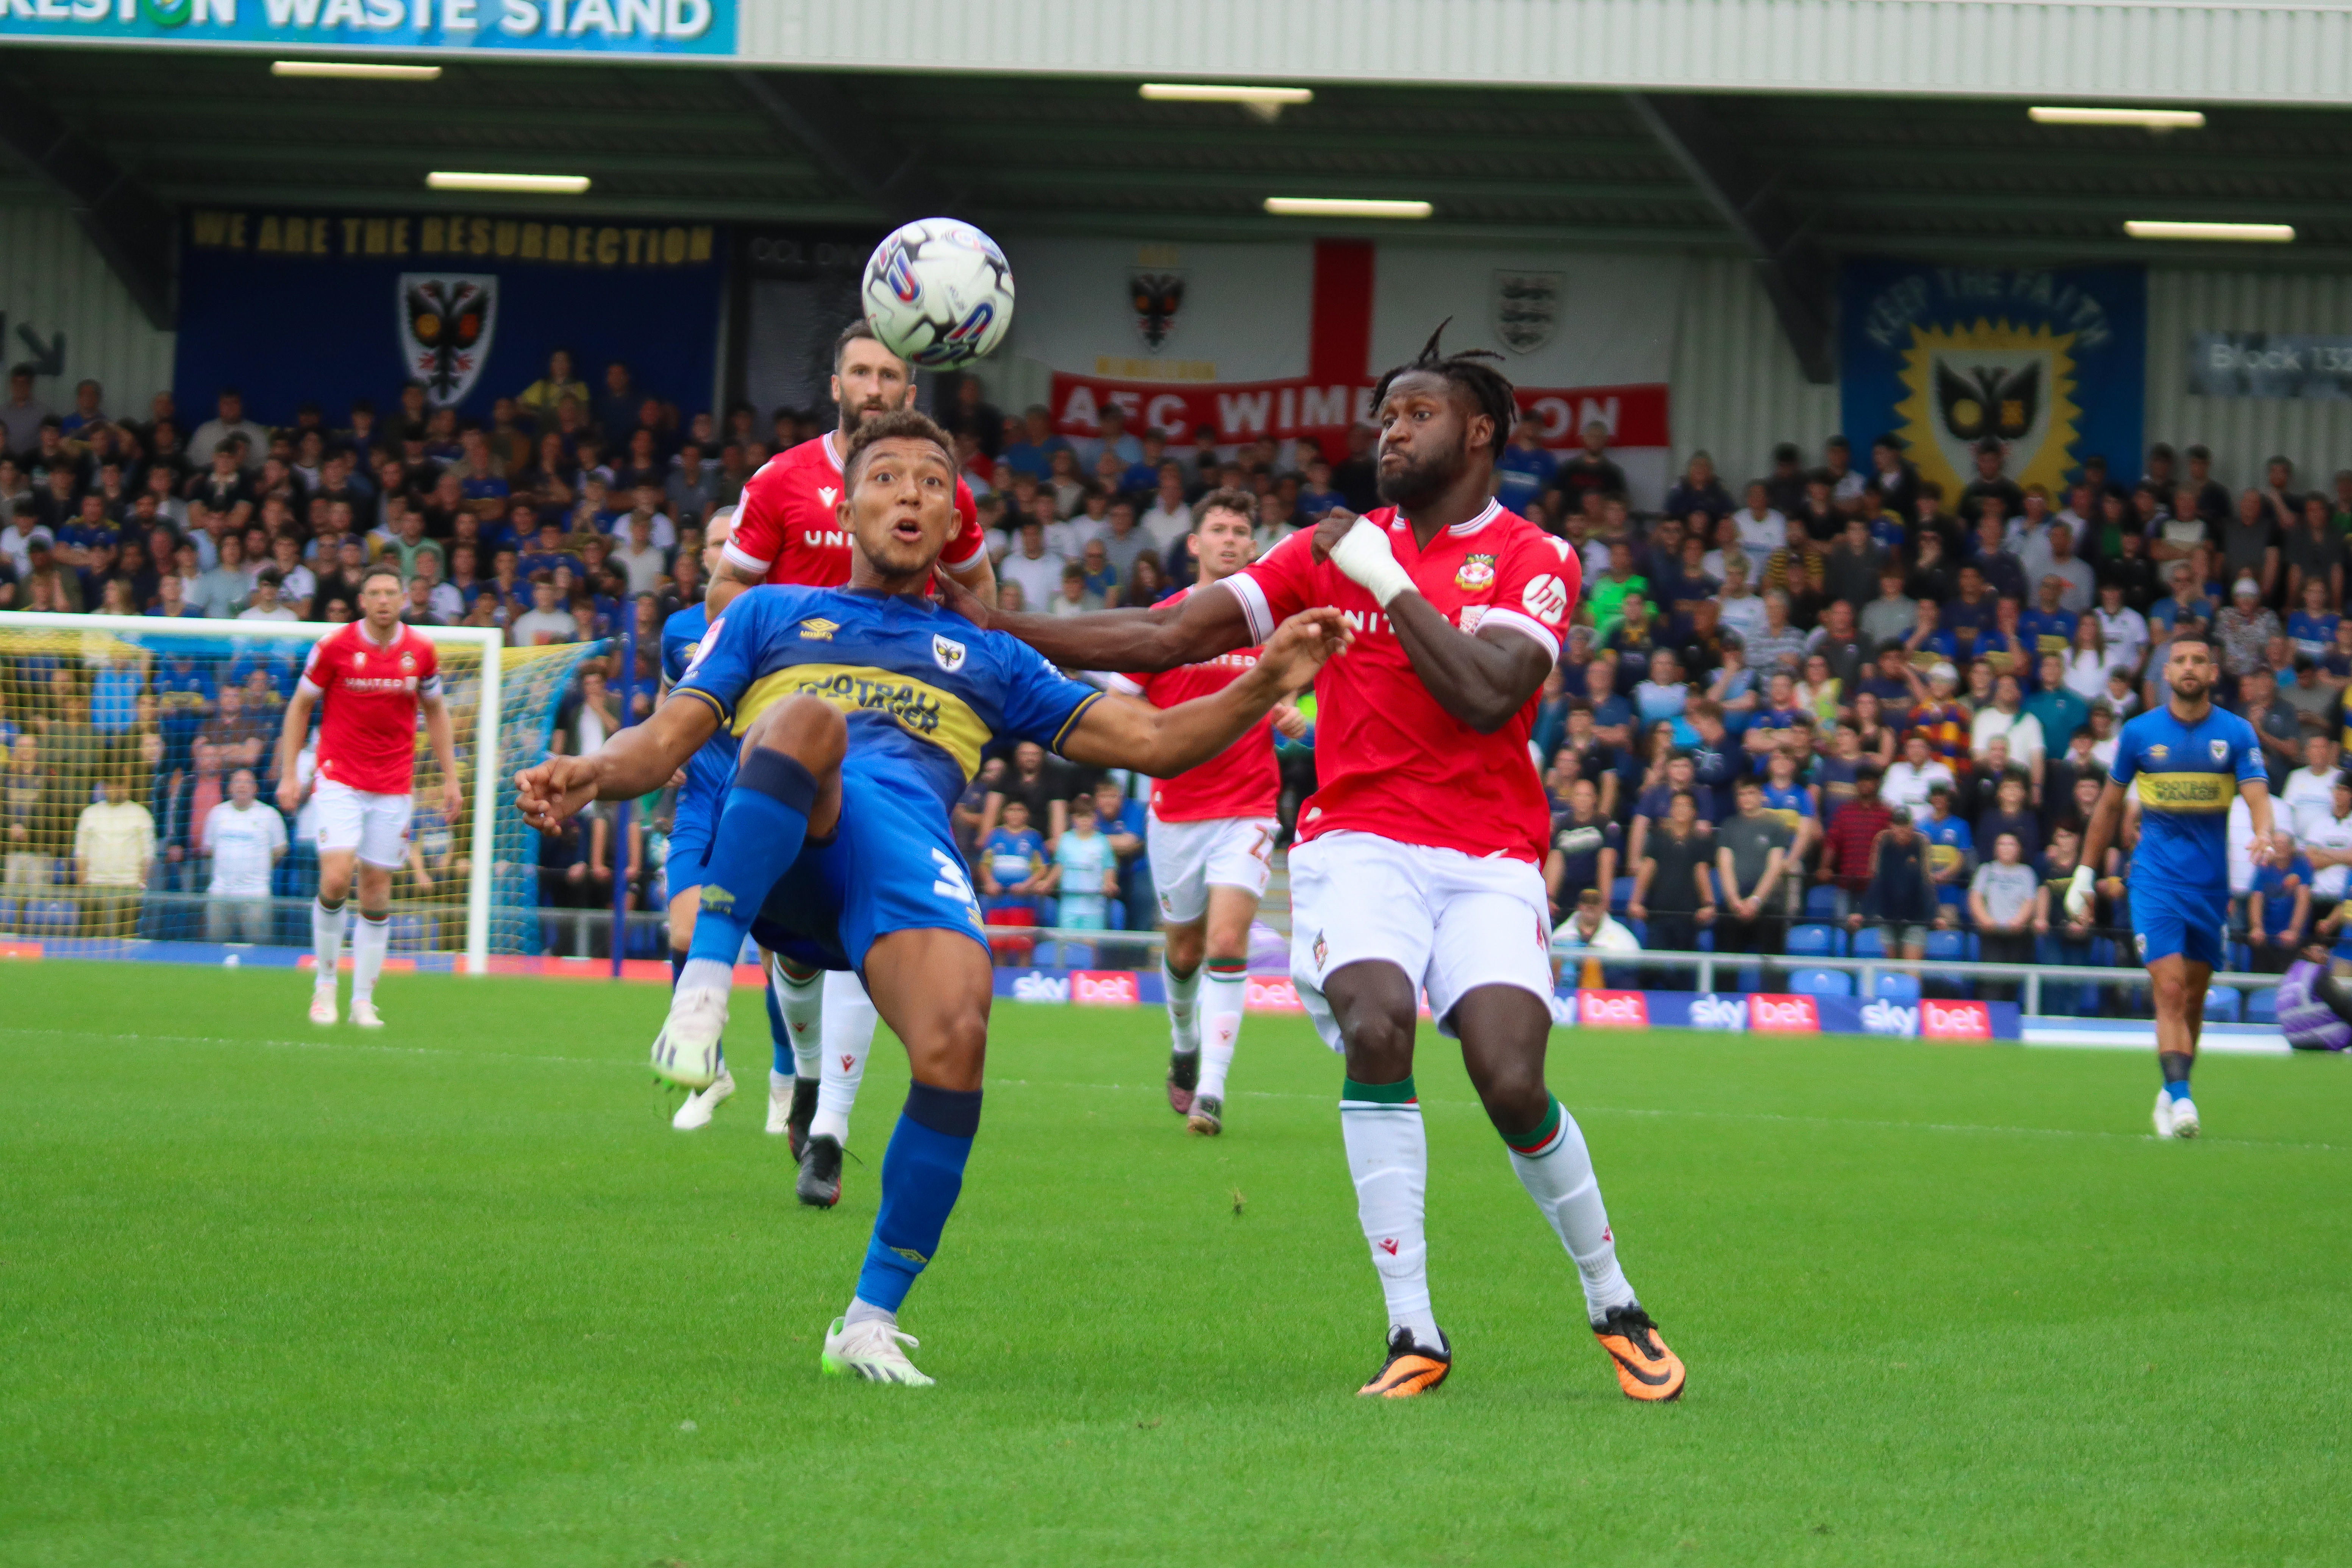
It’s early days, of course, and one should use caution when chewing over any statistics when there isn’t a large amount of data collected. For example, the current figures suggest that we are far more progressive down the left than the right: that might turn out to be true as the season progresses, but after so few games we should acknowledge that the figures are skewed massively by the AFC Wimbledon match.
Jacob Mendy was spectacular up and down the left in that game, so the figures have been warped by his excellence.

Just when the figures seemed to be correcting themselves, James McClean came along with a masterclass at Tranmere to stack up some more spectacular numbers down the left!
The reason there’s more numbers to crunch is because we’ve joined the EFL, of course. Although the full package of stats isn’t available publicly at League Two level, there’s still enough to have fun with.
Opta will have a room full of techie types watching every League Two game, logging data as the game happens. It’s enough to make the nerd in me come out in goose bumps!
National League stats are obtained in a rather less scientific way. For the early years of our time at that level, data would be collected by ex-pros who would spend the whole match on a telephone line, dictating when there was a throw-in, corner or other incident.
The person at the other end of the line would record everything that was said, and the statistics were distributed.
I think it’s fair to say that this method doesn’t lead to terribly accurate, or detailed, figures!
Furthermore, the possession figures were an estimate from the data collector at the ground. If I had received a pound for every time I heard “Ooh, let’s call it 70:30”, I’d be a millionaire!
That’s obviously not the best way to work out the balance of play, and a surprising statistic from last Saturday’s game illustrated that.
Anyone present will confirm that Wrexham completely dominated Tranmere, and ought to have beaten them by a far greater margin. However, the data surprisingly reported that the home side had more possession than us.
Initially I was startled. After about half an hour of the game I’d even said during commentary that I’d have loved to have seen the possession numbers, because I suspected we’d had between 70 and 80% of the ball.
Once I drilled down into the data, the reason for this unexpected figure became clear. Tranmere had indeed had more of the ball, but it was mostly in their own half. Our organisation off the ball forced them into prolonged spells of passive passing, unable to enter into our half until finally one of them snapped and played a hopeful ball forwards, ceding possession to us.
Tellingly, their goalkeeper had the fourth-most touches for Tranmere, with their centre backs the top two as they exchanged passes in their own territory.
The beauty of having so much information, of course, is that I can twist it to suit my own ends when I’m trying to convince everyone that I’m right!


Leave a Reply